Create a A4 poster showing:
Title
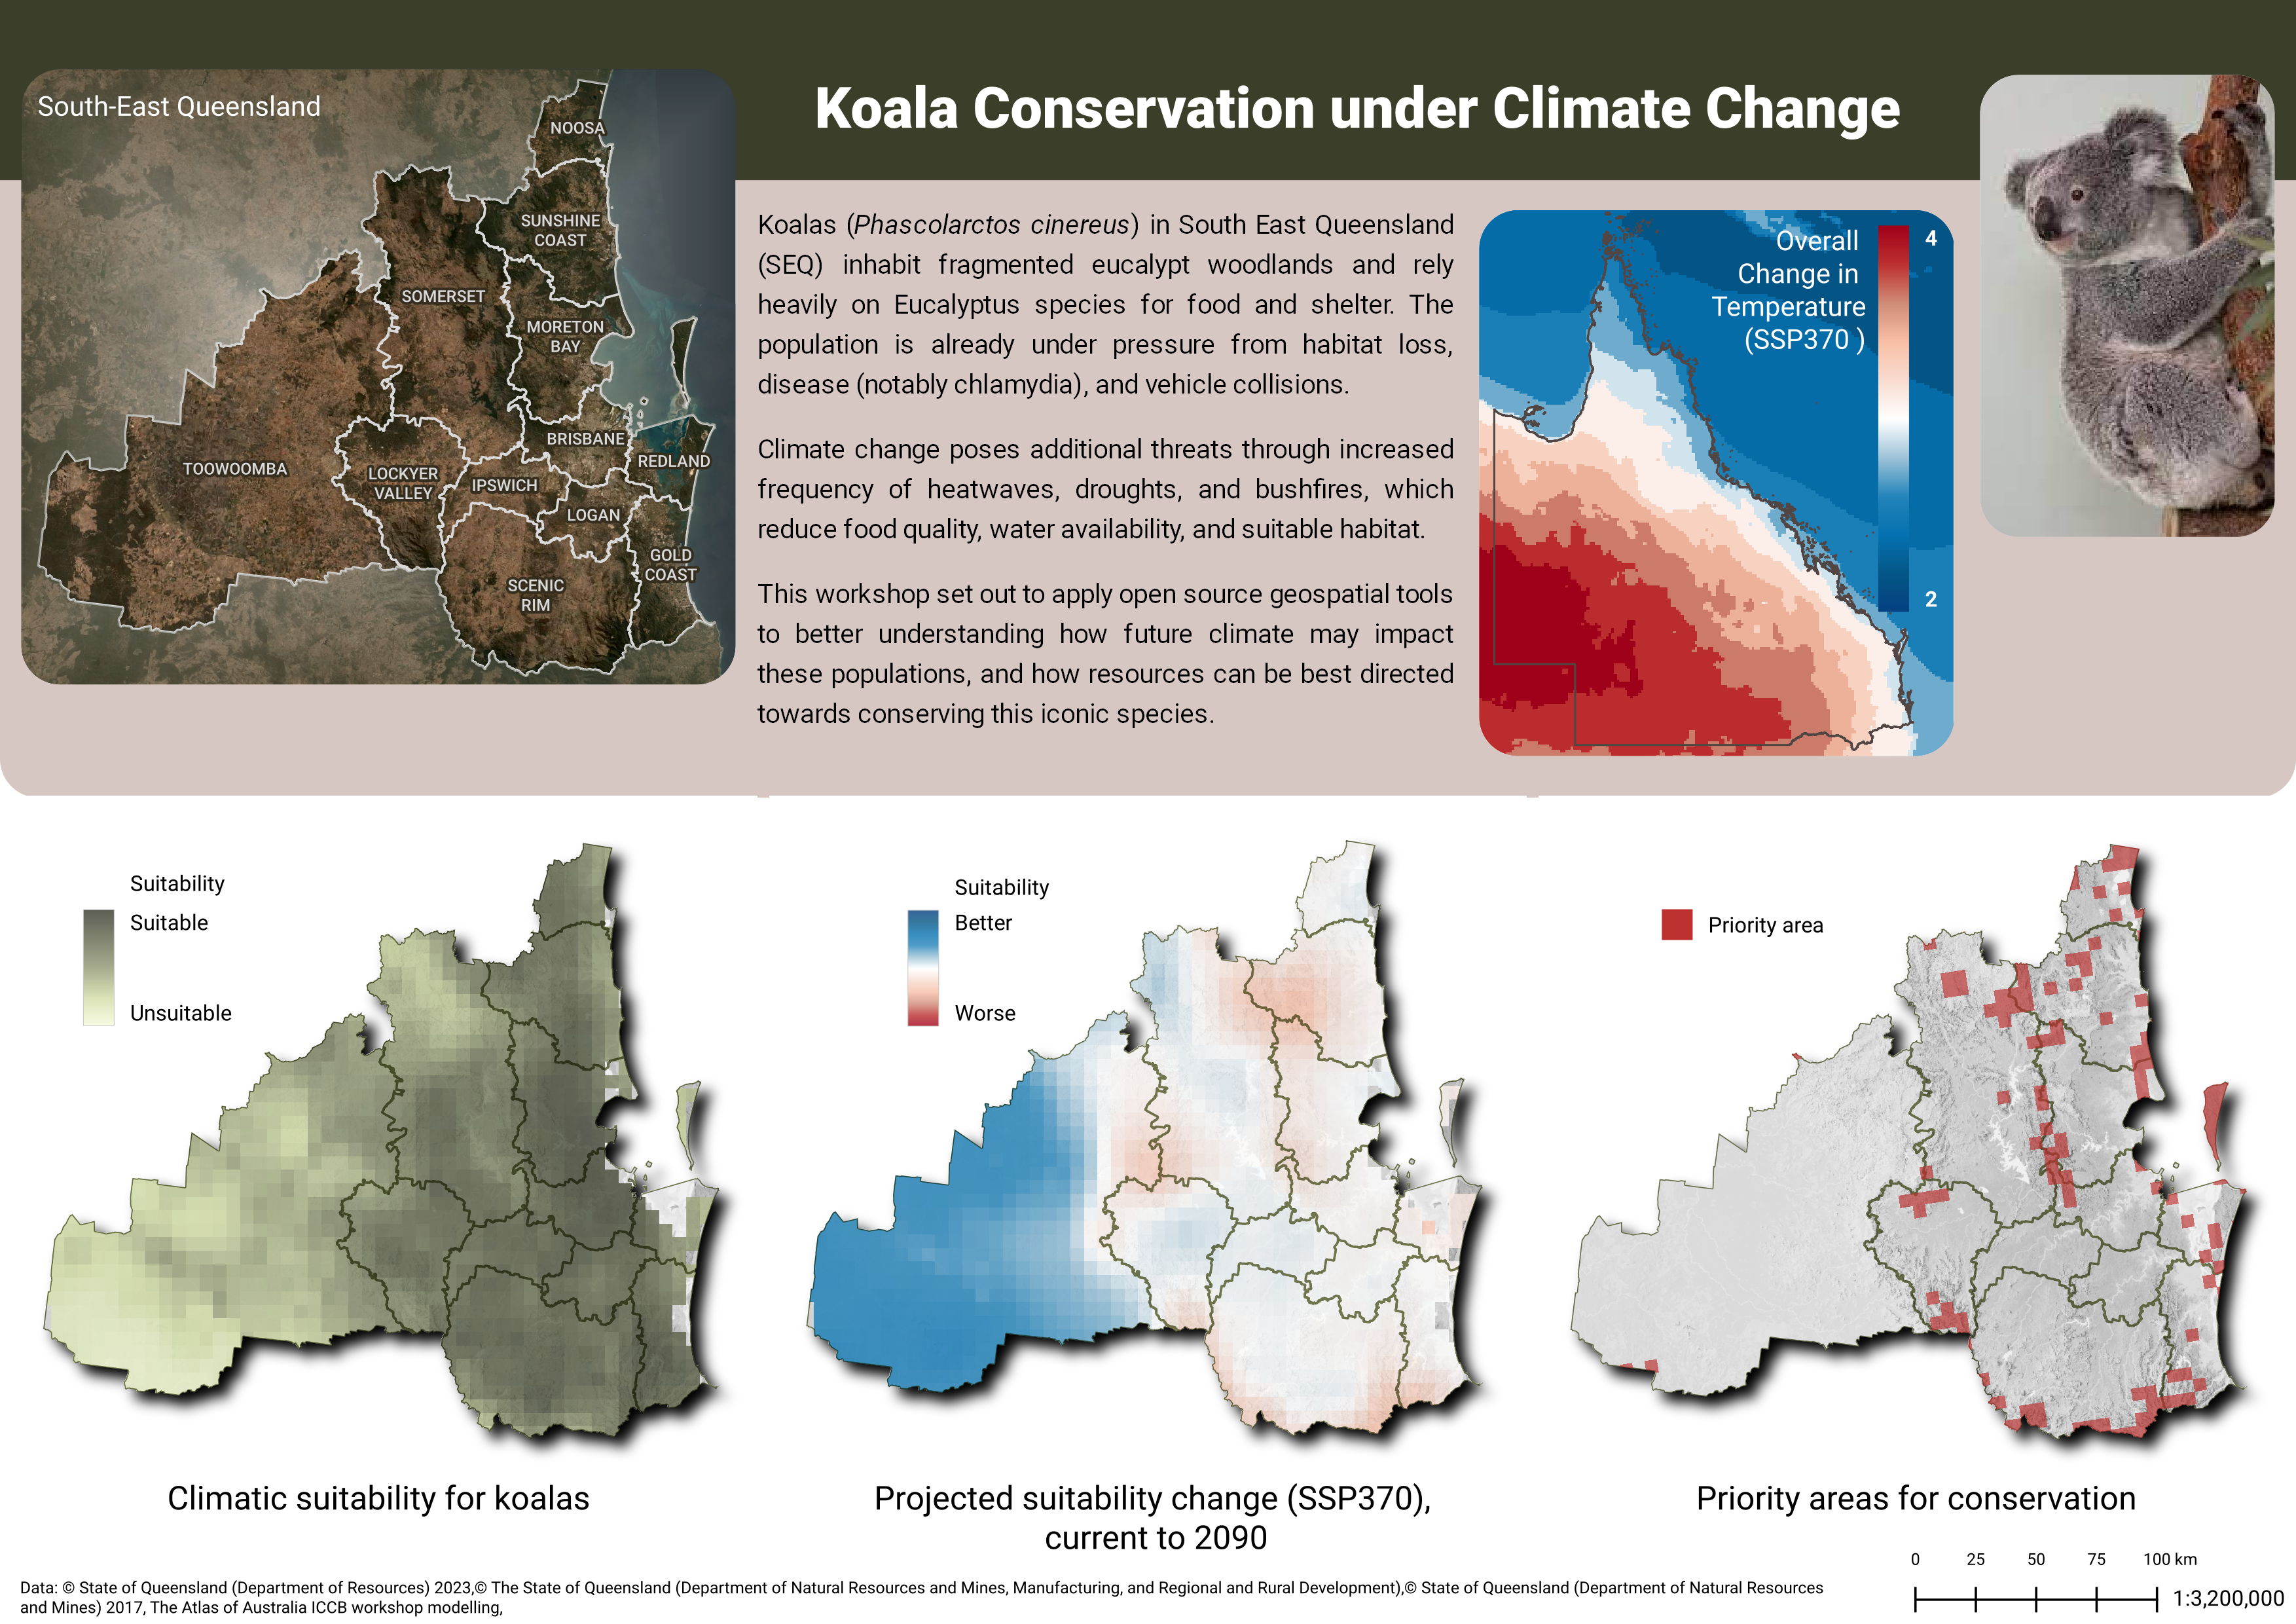
Koala Conservation under Climate Change
Description text
Koalas (Phascolarctos cinereus) in South East Queensland (SEQ) inhabit fragmented eucalypt woodlands and rely heavily on Eucalyptus species for food and shelter. The population is already under pressure from habitat loss, disease (notably chlamydia), and vehicle collisions. Climate change poses additional threats through increased frequency of heatwaves, droughts, and bushfires, which reduce food quality, water availability, and suitable habitat. This workshop set out to apply open source geospatial tools to better understanding how future climate may impact these populations, and how resources can be best directed towards conserving this iconic species.
Picture of a Koala
We’ve taken a picture that has the koala looking to the map details/
- Data: koala_1.jpeg
Maps
-
Area of Interest (AOI) - South East Queensland (SEQ)
- Intention: Giver viewers and idea of where we are geographically set. Dependant on our audience, we may create an inset to show were South East Queensland sits in eith Queensland or Australia
- Data: AOI, LGA, QLD Imagery
- Legend: none
-
Overall Change (climate downscaled model) - Session 2 output
- Intention: Show the difference between the base line (historical) average temperature over Queensland and the temperature at the end of the century under the SSP370 (high) scenario
- Data: tasChange_GFDL-ESM4_r1i1p1f1_CCAM10_AUS-10i_1981-2010-vs-2071-2100
- Symbols: 1 = less change, 4 = greater change degrees C
- Legend: 2/4
-
Climatic suitability for koalas - Session 3 output
- Data: predictions_current
- Symbol: 0 being completely unsuitable and 1 being excellent climatic suitability
- Legend: Suitable/Unsuitable
-
Projected suitability change (SSP370), current to 2090 - Session 3 output
- Intention: change between the current and future suitability - shows koala’s response to the projected climate changes. SSP370 minus current
- Data: SSP370: future370-current.tif
- Symbol: These values range from -1 to 1 and are the predicted changes from the current conditions to the future conditions. When the values are greater than 0 it means that the climatic suitability is predicted to improve, with the magnitude representing how much, and when the values are less than 0, the conditions are predicted to get worse. 0 means no predicted change between current and future climatic conditions.
- Legend: Better/Worse
-
Priority areas for conservation - Session 4 output
- Intention: Show areas throughout SEQ that are priority areas for conservation
- Data: scenario _4.tif
- Symbol: 1 = Priority area
- Legend: Priority area