Data types
In this course, we will be using vector and raster spatial data as well as images to complete our poster.
Download the data from the Get Ready page
Vector data
Point
- Population_centres
Line
- Rivers
- Queensland State border and coastline (supplied)
Polygon
- Local Government Boundaries
- SEQ boundary (supplied)
Raster data
Geotiffs (supplied)
- current_distribution_RF_1.tiff
- future370-current.tiff
- predicted_current.tiff
- scenario_4.tiff
Additional data
Images (supplied)
- koala_1.jpeg
All text for the captions can be found in the content.txt
Loading data
Loading data can occur in multiple ways. For this course, we will use the Browser and the Data Source Manager.
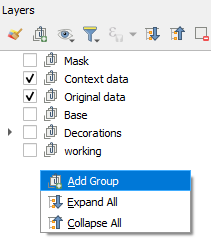
One of the important aspects to an efficient mapping product, is keeping it tidy. A way to do this is to create Groups in the Layers panel.

- Create the above groups in the layers panel by right mouse clicking in the layer panel and selecting
Add group.
Browser
Accessing the data via the Browser panel, we will add the data to the groups.
- Ensure you have the
Browserpanel open.
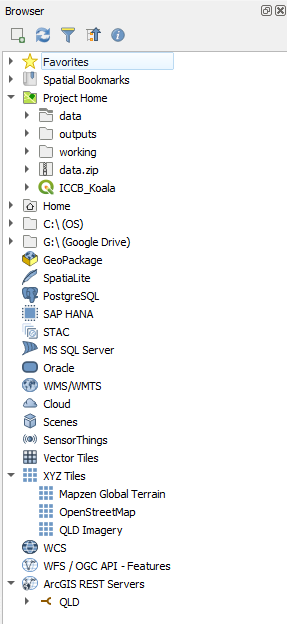
- At the top of the
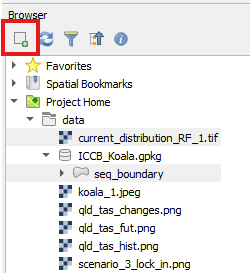
Browser, click on the arrow next toProject Hometo expand it
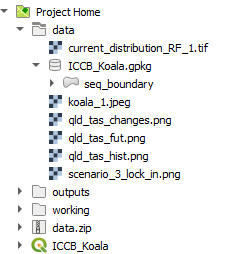
- Expand the Data folder
We are going to select multiple files and load them under the group headings
- First, in the
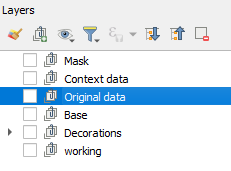
Layerspanel, click on the group ‘Original data’
- Then head over to the
Browserpanel and whilst holding down the ctrl key, click on ‘current_distribution_RF_1.tif’, and the ‘seq_boundary’ (in the geopackage) - With all of these selected, click on the
Add selected layerbutton at the top of theBrowserpanel
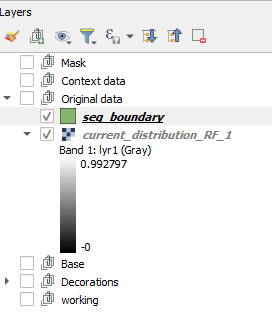
- This results in layers nested under the ‘Original data’ group
Data source manager
We are going to access some data now from the service we have loaded. We can use the Browser panel to do so, but to select data that only occurs in the map extent. In this instance, our Area of Interest - South East Queensland.
- In the
Layerspanel, select turn on the ‘seq_boundary’ layer - Right mouse click on the layer and select
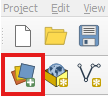
Zoom to layer - Click on the `Open Data Source Manager’ button
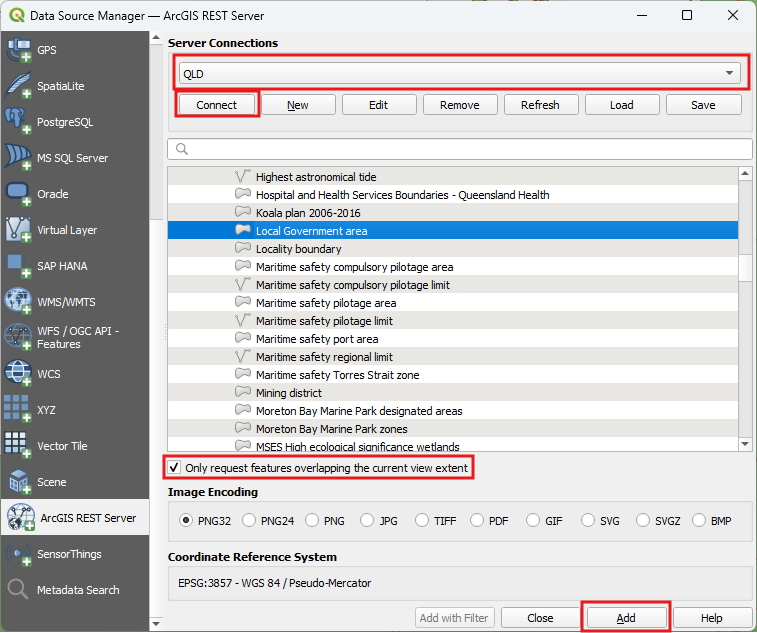
- On the left hand side of the
Data Source Managerscroll down until you see the ArcGIS REST Server and click on it - On the right hand side, click the drop down and select ‘QLD’ (or whatever you named the Qld Spatial Government service)
- Click on
Connect - Click on Boundaries > AdminBoundariesFramework > Local Government area (you will need to scroll down quite a bit)
- Tick
Only request features overlapping the current view extent - Click on
Add
We won’t close this yet as we need to add in watercourses.
- Above the layer list, there is a search bar, type in ‘water’, we are looking for polyline dataset for a river
- Expand ‘Inland River’ and select ‘WatercourseIdentificationMap’ > ‘Watercourse’
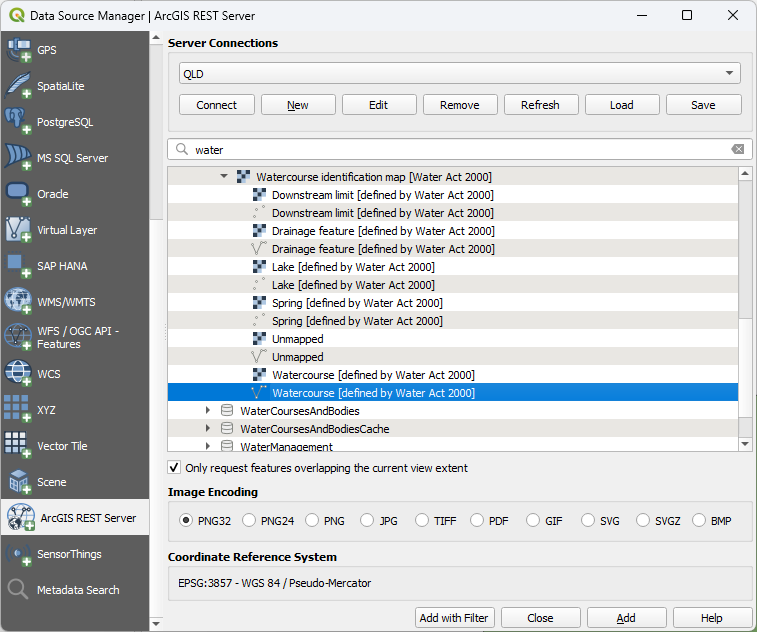
- Click
Add with Filter - The
Expression Builderwill come up. Add in the following ` “name” is NOT NULLand click onOK`
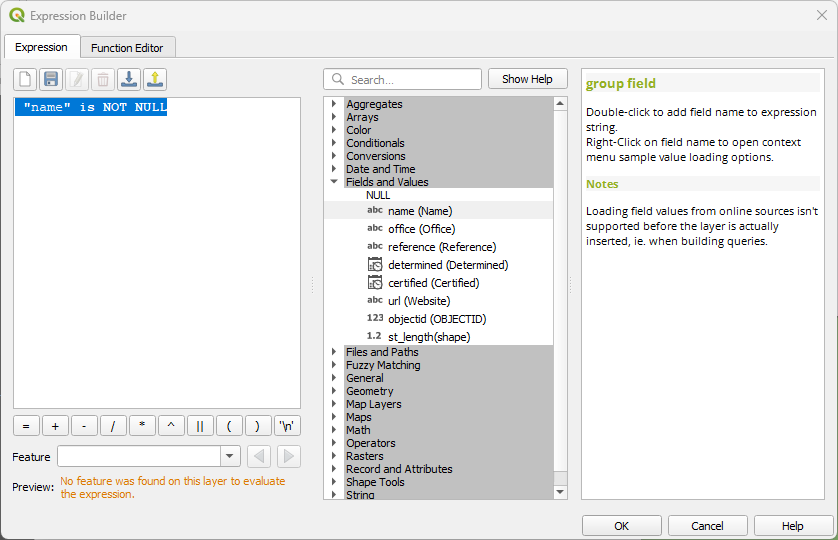
- Click
Add, thenClose - Turn off the watercourse dataset as we do not need it at the moment.
Now add in Population centres using the Data source manager - but be careful to select only those covering the extent.
- It is in the QLD service under Location > Places
- Use the search function to find it quickly
Loading data
Loading data can occur in multiple ways. For this course, we will use the Browser and the Data Source Manager.
One of the important aspects to an efficient mapping product, is keeping it tidy. A way to do this is to create Groups in the Layers panel.
- Create the above groups in the layers panel by right mouse clicking in the layer panel and selecting
Add group.
Browser
Accessing the data via the Browser panel, we will add the data to the groups.
- Ensure you have the
Browserpanel open.
- At the top of the
Browser, click on the arrow next toProject Hometo expand it
- Expand the Data folder
We are going to select multiple files and load them under the group headings
- First, in the
Layerspanel, click on the group ‘Original data’
- Then head over to the
Browserpanel and expand the data folder.
We want to select multiple files and load them into the ‘Original data’ group. We can do this by holding down the ctrl key whilst clicking on multiple the files.
- Hold down the
ctrlkey, and click on the following files- ‘current_distribution_RF_1.tif’
- Expand the geopackage and click on all the layers*
- With all of these selected, click on the
Add selected layerbutton at the top of theBrowserpanel
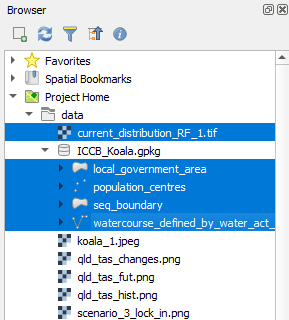
- This results in layers nested under the ‘Original data’ group
- Turn off the layers, population_centres and watercourse
- Save your project
N.B. The layers in the geopackage have been extracted from the ArcGIS REST Service from the Queensland Government. Refer to Ref A - Add Data for step by step instructions for other methods.
Nearly there with the data, we just need to add in a basemap.
- In the
Layerspanel, click on the group ‘Base’ - In the
Browser, underXYZ Tiles, click on ‘Qld Imagery’ - Click on the
Add selected layerbutton at the top of theBrowserpanel
Next, we are going to add in the picture of the Koala. We are doing this as we want to be a little bit clever for some tricks later on. Usually we would just add the picture to the Print Layout.
- In the
Layerspanel, click on the group ‘Decorations’ - In the
Browser, under the ‘Data’ folder, click on koala_1.jpeg - Click on the
Add selected layerbutton at the top of theBrowserpanel - Save your project