All the details
Maps, Scale and Position on Page
| ID | Map | Map Theme | Title | Scale | X | Y | Width | Height | Legend | Note |
|---|---|---|---|---|---|---|---|---|---|---|
| 1 | Area of Interest (AOI) | 1 AOI | South-East Queensland (white 10pt) | 1:3200000 | 2.596 | 8.795 | 92.638 | 79.841 | n/a | Decoration ‘shape’ |
| 2 | Overall Change (climate downscaled model) - s2 | 2 Overall Change (climate downscaled model) | Overall Change in Temperature (SSP370 ) (white 10pt) | 1:24990123 | 188.025 | 25.558 | 68.037 | 73.848 | Color ramp taken from proxy ‘Legend’; 2 to 4 | Use the projection option in the Print Layout to change to 4326 |
| 3 | Climatic suitability for koalas - s3 | 3 Climatic suitability for koalas | Climatic suitability for koalas (black 12pt) | 1:3200000 | 0.000 | 102.906 | 98.000 | 90.000 | Color ramp; Unsuitable to Suitable | n/a |
| 4 | Climatic suitability for koalas - s3 | 4 Projected suitability change (SSP370) | Projected suitability change (SSP370), current to 2090 (black 12pt) | 1:3200000 | 99.500 | 102.906 | 98.000 | 90.000 | Color ramp; Worse to Better | n/a |
| 5 | Koala priority areas - s4 | 5 Priority areas | Priority areas for conservation (black 12pt) | 1:3200000 | 199.000 | 102.906 | 98.000 | 90.000 | proxy ‘Legend’ | n/a |
| 6 | Koala image | 6 Koala image | n/a | 1:4517.773 | 255.990 | 0.500 | 48.812 | 83.954 | Legend | Decoration ‘shape’ |
Other elements and Position on Page
| ID | Map | Font | Size | Color | X | Y | Width | Height | Alignment/Type | Note |
|---|---|---|---|---|---|---|---|---|---|---|
| 1 | Scale text | Roboto | 8 | Black | 280.056 | 204.100 | 18.113 | 5.752 | Numeric | n/a |
| 2 | Scale bar | Roboto | 6 | Black | 245.883 | 199.350 | 39.616 | 10.650 | Line Ticks Middle or your choice | Segments: left;0/right 4, Fixed width 25.0 units |
| 3 | Data credentials | Roboto | 6 | Black | 2.596 | 204.100 | 236.516 | 4.412 | Left | Uses dynamic and free text |
| 4 | Problem statement | Roboto | 10 | Black | 98.000 | 27.036 | 90.113 | 70.891 | Justify | Html, Line height 130% |
| 5 | Pink rectangle | n/a | n/a | #d6c7c2 | 0.000 | 17.515 | 297.000 | 85.641 | n/a | Decoration ‘shape’ |
| 6 | Green rectangle | n/a | n/a | #3b3e29 | 0.000 | 0.000 | 297.000 | 23.300 | n/a | Decoration ‘shape’ |
| 7 | Main Title | Roboto ‘Black’ | 21 | White | 95.235 | 9.473 | 160.756 | 8.042 | Centre | Center to the AOI and Koala elements |
Things to note:
- The scale is the same for all the maps, except the the Overall Change in Temperature
Position and Sizecontrols can be used to finely position and make the maps uniform
Let’s make the map!
There is a reference image in the Project folder and also on this website. There is also a template that can be used (a4_iccb_v8.qpt). If we are running out of time, we will use the print layout already loaded.
1 Build a map
- Click on
Project > New Print layout- Give it a name ‘ICCB Koala A4 v1’
- Right click on the page and click on ‘Page Properties’
- Make sure it is A4
- Save your project
Take a moment to learn how to navigate around the Print Layout
When you navigate around the print layout screen, you have the panels and toolbars, following the logic as what is used in the Map Canvas. These all help set the parameters for the elements on the page.
The panels include:
- Item properties: used to set font, position on the page and specific requirements to the types of items like scale.
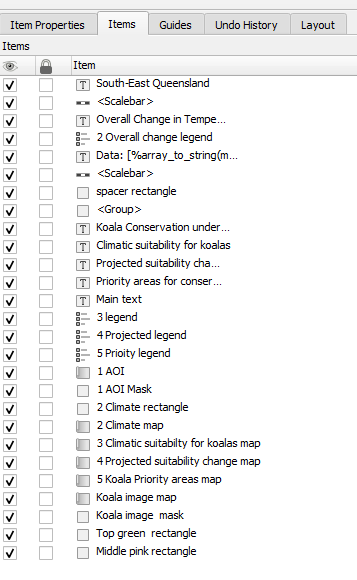
- Items: listing of all the items. These items can be selected, deleted, moved up or down in order or renamed here.
- Guides: set up guides to help with positioning
- Undo history: check your history and revert back
- Layout: overall layout requirements, good to check before printing
Several toolbars are present, but the one most used in this exercise will be the ‘Toolbox’.

From left to right, those highlighted are:
- Move item content
- Add map
- Add shape
2 Set up the map text type
Did you know you can set the text for the whole print layout - this saves so much time. For this product, we are going to use Roboto.
- Click on
Settings > Layout Options- On the left, click on ‘Layouts’
- In the ‘Default font’ click the drop down, type ‘R’ and then scroll down to Roboto
- Click ‘OK’
- Save your project
3 Add in the decorations
Lets add in the rectangles that are in the background for the upper part of the page.
First, lets create the green rectangle:
- Click on `Add shape > Add Rectangle’
- Draw a thin rectangle that streches the breadth of the page
- Click on the
Item Propertiestab- Give it a green color #3b3e29
- Remove the line if it has one
- Under position and size, give it a height of 23.300mm and position it at 0/0
- Check the width is 297mm
- In the ‘Items’ tab, name is green rectangle
- Save your project
- Copy and paste the green rectangle
- Click on the
Item Propertiestab- Set the corner radius to 5
- Give it a koala pink color #d6c7c2
- Remove the line if it has one
- Under position and size, give it a height of 85.641 and position it at 0/17.515
- Check the width is 297mm
- In the ‘Items’ tab, name is pink rectangle
- Make sure it sits under the green rectangle
- Save your project
4 Add in the koala
Because we want to create a rounded frame around the koala, we need to add it as a map feature.
- Click the
Add mapbutton on the toolbox toolbar- Draw the box somewhere near the upper right of the page
- In the
Item Properties, check theFollow map themeand from the dropdown, select 6 Koala image- Down towards the bottom, make sure
Backgroundis unchecked
If it doesn’t show, go back to the Map Canvas, right click the koala layer and select Zoom to Layer. To switch between the Map Canvas and the Print Window is just like switching between two open windows on your computer.
- On the top of the
Item Properties, click on the second button in to set the map extent to the current one.- In the
Scaleenter 1:4517.773- Amend the
Position and Size
- X: 255.990
- Y: 0.500
- Width: 48.812
- Height: 83.954
- Switch over to the
Itemspanel and name the map ‘6 Koala map’- Save your project
Add a frame**
Now we are going to make it fancy by giving it a rounded frame
- Click on the
Add shape > Add rectangle- Draw a rectangle over the koala
- Set the corner radius to 5
- Change the fill style to ‘no fill’
- Amend the
Position and Size(make sure you DON’T do this in the Extents section)
- X: 256.140
- Y: 9.691
- Width: 38.081
- Height: 59.712
- Click `Move item content’ on the toolbox toolbar and click on the to move the koala image to it appears within the frame
- Switch over to the
Itemspanel and rename this frame ‘6 Koala frame’- Save your project
- Make the koala map active - as you have the frame over it, this may not be able to be selected. Use the ‘Items` tab instead to make it active.
- Switch back to Koala’s
Item propertiesand in the top of this panel, click on the last iconClipping Settings- In the dialog, check the box
Clip to Item- From the dropdown, select ‘6 Koala frame’
- Save your project

5 Add in the map windows
Let’s add the map windows - there are 5 and most of them are the same size (or close to it). So we add one and then copy it over and change the map theme. Saves time! Let’s start with the map - 1 AOI
- Switch back to the the
Map Canvas- In the ‘Context data’ group, right click the ‘LGA’ layer and select
Zoom to Layer- Click the
Add mapbutton on the toolbox toolbar- Draw the box somewhere near the upper left of the page
- In the
Item Properties > Position and Size, enter in the size of the map:
- w: 92.638
- h: 79.841
- Set the scale: 1:3200000
- In the
Item Properties, check theFollow map themeand from the dropdown, select ‘1 AOI’- Switch over to the
Itemspanel and name this map window ‘1 AOI’- Copy this map window and place it in the lower part ofthe page
- In the
Itemspanel and name this map window3 Climatic suitability for koalas- Click back on ‘1 AOI’
- Amend the
Position and Size
- X: 2.596
- Y: 8.795
- Save your project
Whilst it is still fresh in your mind, let’s add in the fancy frame to the AOI by following the instructions in the previous section with the following parameters:
- Name: 1 AOI frame
- Corner radius: 5
- X: 2.746
- Y: 8.945
- Width: 92.338
- Height: 79.541
- Save your project
Add in the other top map 2 - Overall Change (climate downscaled model) - s2
- Switch back to the the
Map Canvas- In the ‘2 Overall Change (climate downscaled model) - s2’ group, right click the ‘7844tasChange…’ layer and select
Zoom to Layer- Click the
Add mapbutton on the toolbox toolbar- Draw the box left of the koala
- In the
Item Properties > Position and Size, amend the following:
- X: 188.025
- Y: 25.558
- w: 68.037
- h: 73.848
- In the
Item Properties, check theFollow map themeand from the dropdown, select ‘2 Overall Change (climate downscaled model)’- Click on
CRSand select ‘EPSG: 7844’

- Set the scale: 1:24990123
- Switch over to the
Itemspanel and name this map window2 Overall Change map
Add in a frame to sit over it:
- Name: 2 Overall Change frame
- Corner radius: 5
- X: 191.328
- Y: 27.186
- Width: 61.447
- Height: 70.591
- Save your project
If the map is not fully in the frame, move it using the Move item content tool.
- In the
Itemspanel, uncheck the ‘2 Overall Change frame’- In the
Toolboxtoolbar, select theMove item contentbutton- Click in the map image and move it to hide any blank spaces
Add in the lower 3 maps
- Click on map 3 - Climatic suitability for koalas
- In the
Item Properties, check theFollow map themeand from the dropdown, select ‘3 Climatic suitability for koalas’- In the
Item Properties > Position and Size, enter in the size of the map:
- X: 0
- Y: 102.906
- Width: 98
- Height: 90
- Set the scale: 1:3200000
- Save your project
- Copy this map window and place it to the direct right
- In the
Item Properties, check theFollow map themeand from the dropdown, select ‘4 Projected suitability change (SSP370)’- In the
Itemspanel and name this map window ‘4 Projected suitability change (SSP370)’- Click back on ‘1 AOI’
- In the
Item Properties, amend thePosition and Size
- X: 99.500
- Save your project
- Copy this map window and place it to the direct right
- In the
Item Properties, check theFollow map themeand from the dropdown, select ‘5 Priority areas’- In the
Itemspanel and name this map window ‘5 Priority areas’- In the
Item Properties, amend thePosition and Size
- X: 199.000
- Save your project
- In the
Itemsmove maps 3-5 to sit below the pink rectangle
6 Add in the legends
The legend operations in QGIS is super powerful and there is ongoing development work. North Road has developed quite a few of the functions you will use. You don’t have to accept how a legend item comes in. You can change how it looks, through sizing, font and formats. We are going to amend the text and size of the legends and also add in some proxy legends for visual purposes.
Let’s start with map 3 - Climatic suitability for koalas
- On the top menu
Add Item > Add Legend- Draw a box to place the legend anywhere on the map (we will move it later)
- Ensure the legend matches your Map from the dropdown - let’s start with map 3
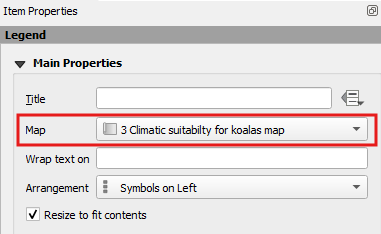
- Under the
Legend Itemsection, uncheckAuto update- Select all the legend items in the window and delete them by click the red ‘minus’ sign below the window
- Click on the green ‘plus’ sign
- In the dialog
Add Layer to Legend, at the bottom, click on the ‘Show visible layers only`
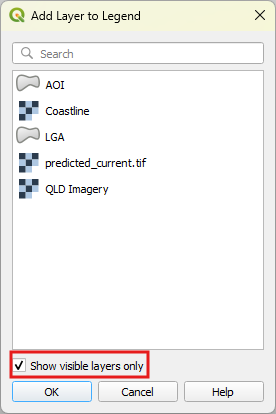
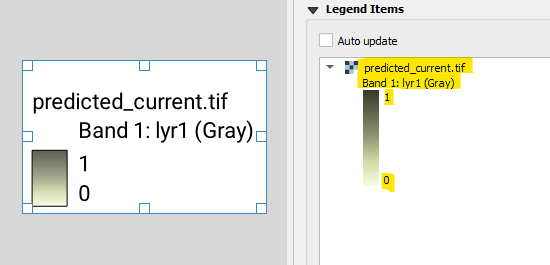
- Add in the required data: ‘predicted_current.tf’
Now this legend looks super clunky, so we are going make a little bit better.
For maps 3-4
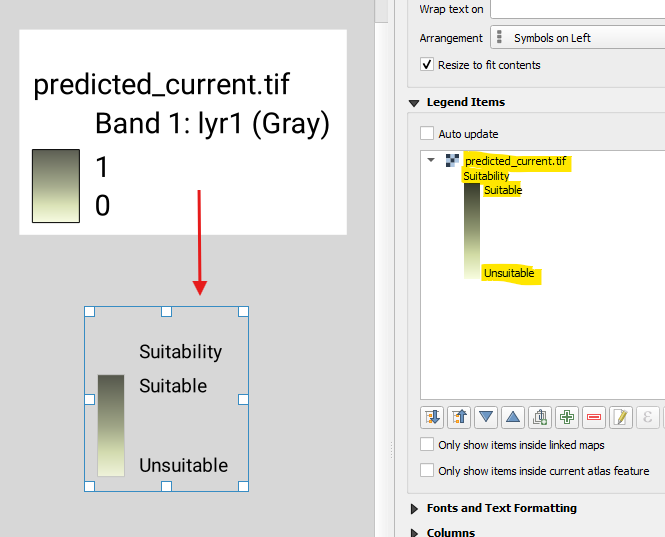
Let’s amend the text in the legend item:
- In the
Legend Items, right mouse click on the title of dataset, and click ‘Hidden’- Double click on the ramp title ‘Band 1:…’ - this will take you into an editing widget
- Replace the text with the legend title to reflect the values of the ramp ‘Suitability’
- Now, double click on the vertical ramp itself
- In
MinimumandMaximum, enter the required values
- min: Unsuitable
- max: Suitable
- Click back to return to the main panel
- Expand
Fonts and Text Formattingand click on theItem font- change this 8
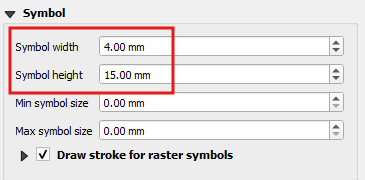
Let’s amend the symbol size
- Next expand
Symboland change the width to 4.00mm and the height to 15.00mm- Position it to the upper left of the assocaited map
- Save your project
Repeat for map 4 - hint, you can copy and paste legends and change the content. This will keep the same format for font/size
- Copy and paste the legend into the map 4 area
- Change the map to ‘4 Projected suitability change (SSP370)’
- Click on the green ‘plus’ sign
- In the dialog
Add Layer to Legend, at the bottom, click on the ‘Show visible layers only`- Add in the required data: ‘future370-current.tif’
- remove the map 3 data bly clicking on it and the red minus sign
- Follow the directions above to amend the title and values to:
- Title: Suitability
- Min: Worse
- Max: Better
- Save your project
Proxy legends
Sometimes a legend does not work in your favour, so you need to do some magic.
Map 2 - Overall Change in Temperature
In this instance, the raster styling is ‘Discrete’ and therefore returns a legend such as this:
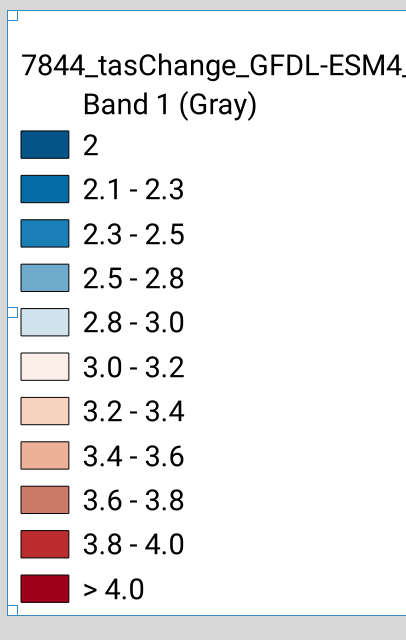
But we want to put in a ramp here, if the product was more technical, then we would spend the time in amending it through the size of the symbol and cutting out the spaces between the symbols and removing the black outline. However, I want you to learn how to approach a problem like this by using a proxy.
- Switch back to the
Map Canvas,- Turn on the
Map theme‘2 Overall Change (climate downscaled model)’- Under the 2 Map group, duplicate the data and call it ‘legend’
- Change the Interpolation to ‘Linear’
- With the legend and original dataset layers turned on, In
Manage Map themes, replace theme ‘2 Overall Change (climate downscaled model)’- Save your project
- Switch back to the
Print Layout- Add a legend item and make sure it’s linked to the map 2
- Add in the ‘legend’ dataset for it
- Run through the amendements as per last exercise using the following parameters
- Title: no title - put in a space
- Min: 2
- Max: 4
- Symbol size: 4 x 50mm
- Uncheck ‘Draw stroke for raster symbols’
- Set the font: white 8pt
- Uncheck the Background
- Place it on the right side of the map
- Save your project
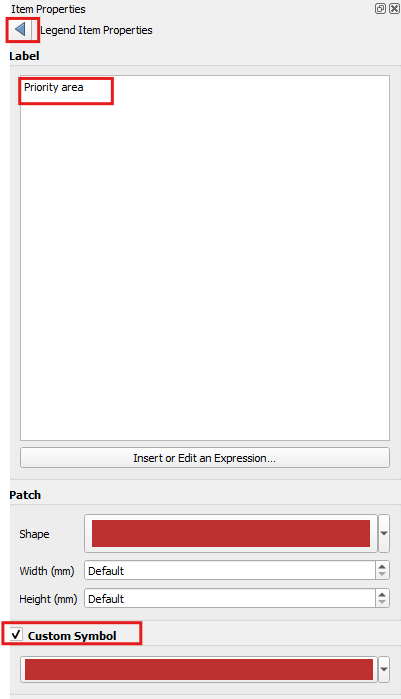
Map 5 - Priority Areas for Conservation For some reason, the scenario dataset is not showing up, so we are going to create one from another dataset.
- Create a legend item and remove all of the items
- Link it to map 5
- Add in the dataset ‘AOI’
- Double click on the dataset to open up the
Legend Item Properties- Change the text to ‘Priority area’
- Check the
Custom Symboland click in the color bar- Click through to change to red (color code ‘#bc3030’)
- Click on the back arrow at the top
- Under
Symbol, make it a square - enter in the width 4.00mm and height 4.00mm into the fields- Save your project
7 Add in the text
Problem statement to add
The text we want to use is:
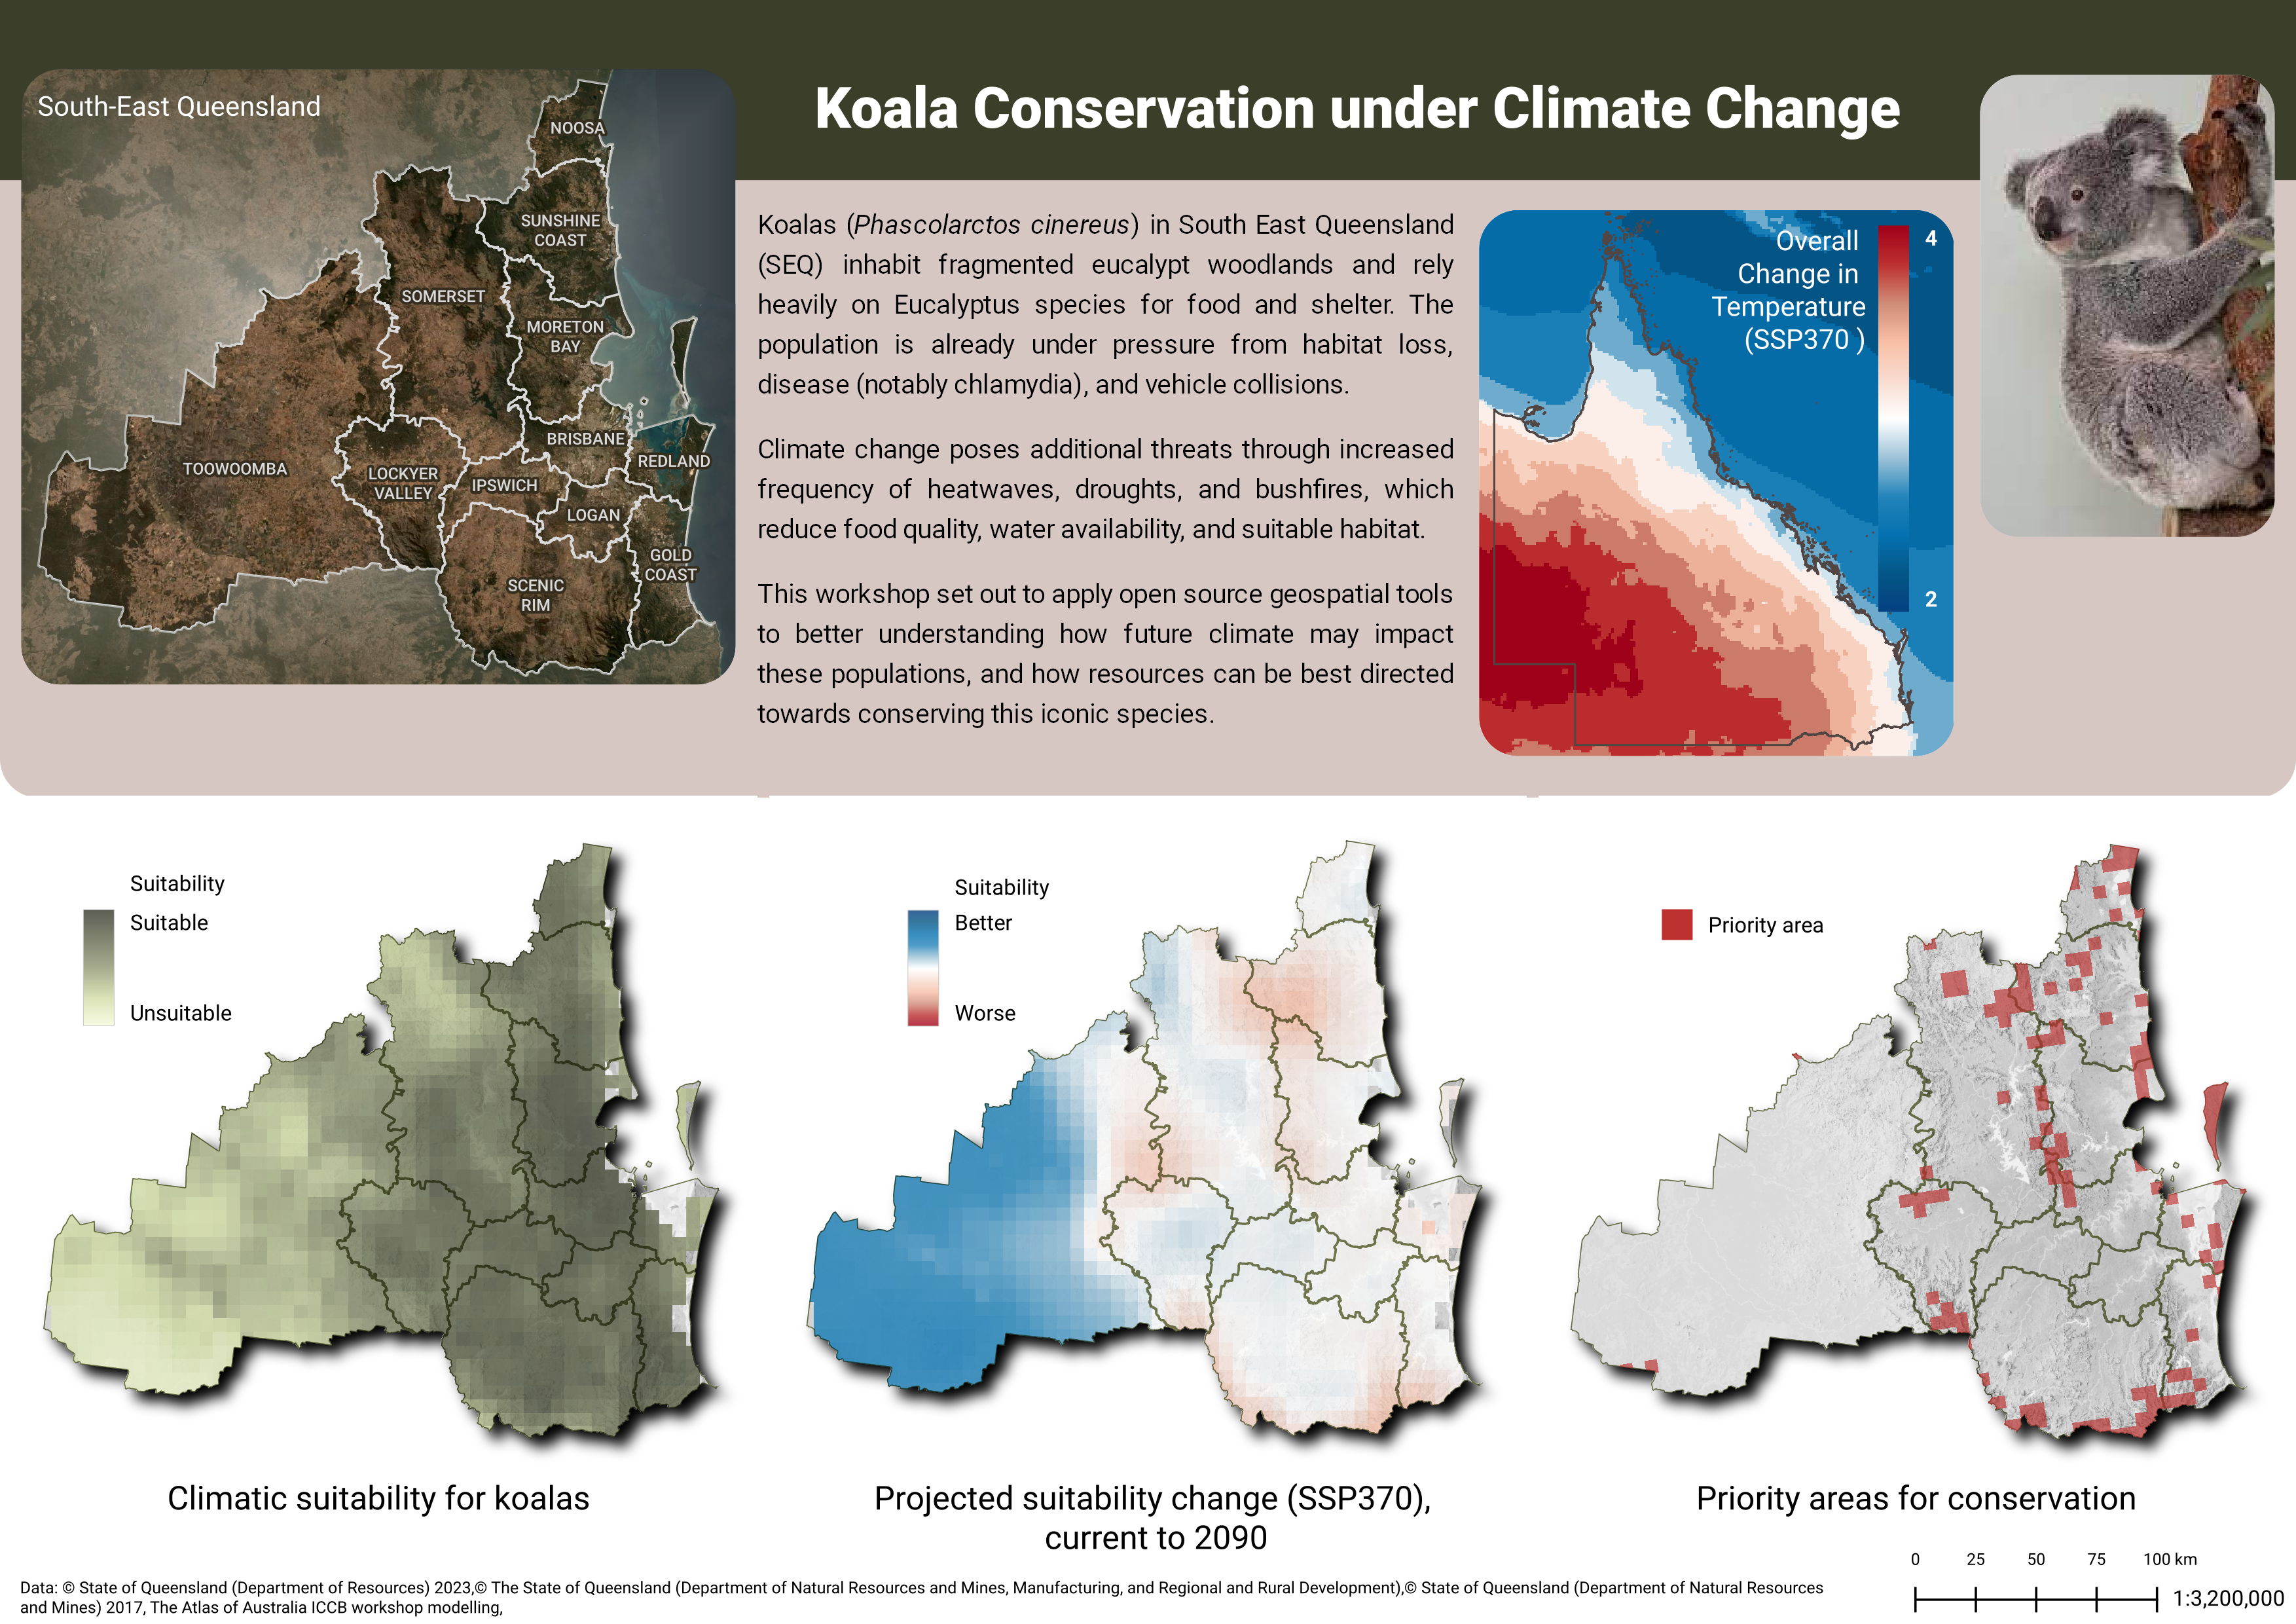
Koalas (Phascolarctos cinereus) in South East Queensland (SEQ) inhabit fragmented eucalypt woodlands and rely heavily on Eucalyptus species for food and shelter. The population is already under pressure from habitat loss, disease (notably chlamydia), and vehicle collisions. Climate change poses additional threats through increased frequency of heatwaves, droughts, and bushfires, which reduce food quality, water availability, and suitable habitat. This workshop set out to apply open source geospatial tools to better understanding how future climate may impact these populations, and how resources can be best directed towards conserving this iconic species.
But as we need to itlaicised the scientific name, we need to turn this into HTML text as per the block below. Copy the block into your text box:
<p> Koalas (<i>Phascolarctos cinereus</i>) in South East Queensland (SEQ) inhabit fragmented eucalypt woodlands and rely heavily on Eucalyptus species for food and shelter. The population is already under pressure from habitat loss, disease (notably chlamydia), and vehicle collisions. </p>
<p>Climate change poses additional threats through increased frequency of heatwaves, droughts, and bushfires, which reduce food quality, water availability, and suitable habitat. </p>
<p>This workshop set out to apply open source geospatial tools to better understanding how future climate may impact these populations, and how resources can be best directed towards conserving this iconic species. </p>
- Click on the text button in the
Toolboxtoolbar- Draw a square between the AOI and Climate map on the pink background
- Copy and paste the above htmml text
- Check the button ‘Render as HTML’
- Click on font and check the size is 10pt
- Click the second tab
Formatting- Change the line height percentage to 130
- In the
Item Properties, amend thePosition and Size
- X: 98.000
- Y: 27.036
- W: 90.113
- H: 70.891
- In the Appearance, set the
Horizontal alignmentto ‘Justify’- Save your project
9 Scale bar
The scale bar option has many options, including the scale text known as Numeric or different visual reqpresentations of the bar
- On the top menu
Add Item > Add Scale Bar- Draw a box to place the Scale Bar on the lower right
- Link the scale item to Map 3
- Select the type as ‘Numeric’ - this gives us out scale text statement e.g. 1:32 000 000
Remember all of our maps are 1:3 200 000 (except map 2), so this scalebar wil pertain to all the lower maps and AOI
- In the
Item PropertiesChange font viaAppearance > Font- In the font properties, change the size to 8pt
- Click the back button
- Make sure this text is located close to the lower right edge of the page
- Under
AppearanceclickAlignmentto ‘Right’- Save your project
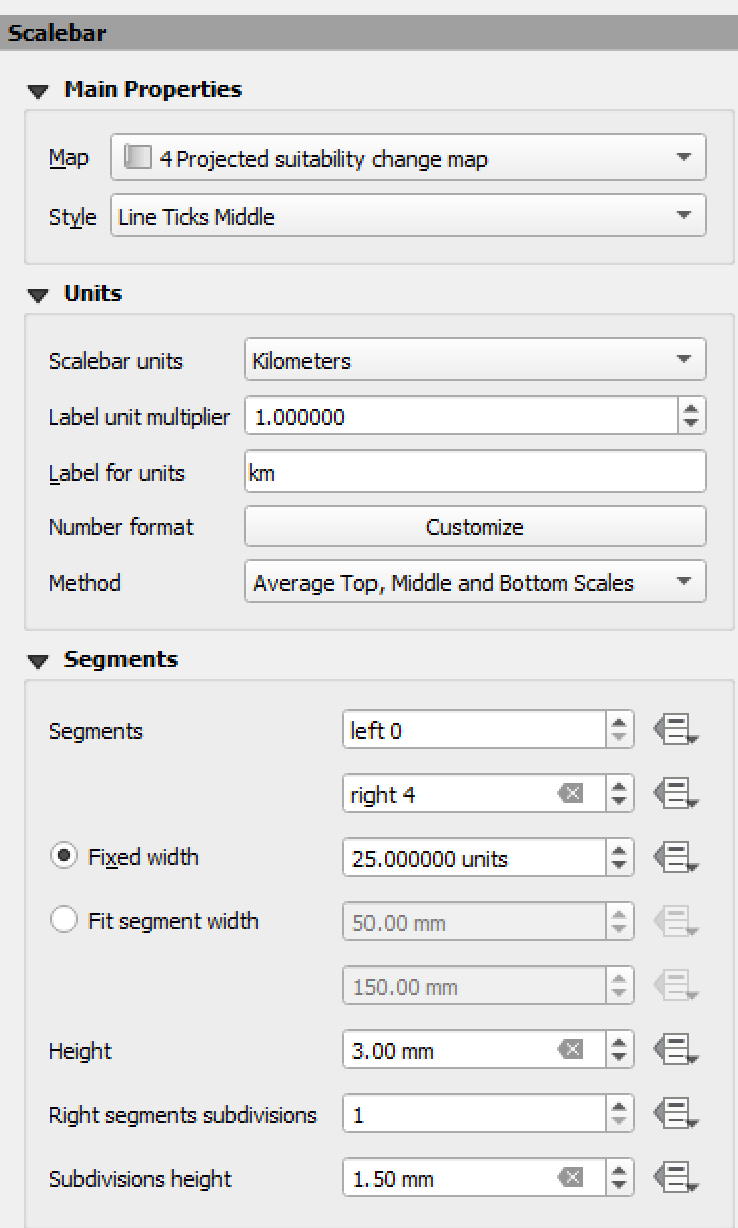
Now we are going to add in the scale bar.
- On the top menu
Add Item > Add Scale Bar- Draw a box to place the Scale Bar anywhere on the map (we will move it later)
- Link the scale item to Map 3
- Select the type as ‘Numeric’
- Set the parameters as per the image below
- Save your project
- In
Appearance > Fontset the font to 6- Move it so it sits nicely next to the scale text
- Save your project
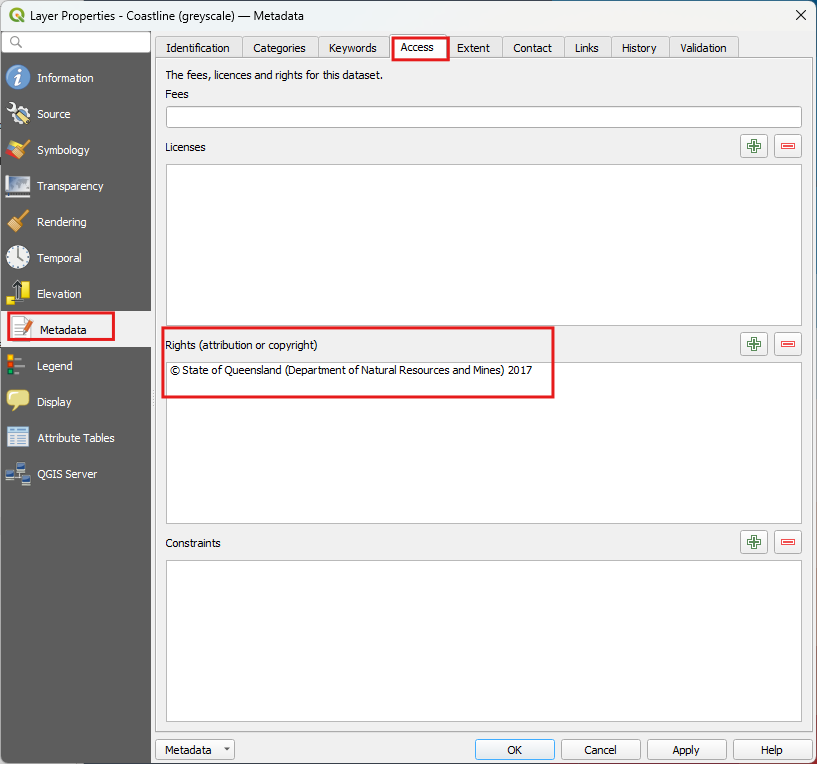
10 Data credentials
Add in the data credentials text. The interesting aspect here is that if the data has an attribution in the Layer properties including under Metadata/Access/Rights , we can bring it in using dynamic text. This can be used easily with freetext as well.
- Click the
Add labeltool from the toolbox toolbar- Draw a rectangle at the bottom left of the page
- Type: ‘Data: ‘
- Select the
Dyanmic Textdropdown and select ‘Layer Credits’- Next to it, you can add in additional credits if they aren’t built into the layers as well as any other information you need to tell the viewer.
- Save your project
11 Add in the titles
Let’s add in the titles.
- Main title - Koala Conservation under Climate Change (Roboto black white 21pt)
On the maps:
- Map 1 - South-East Queensland (white 10pt)
- Map 2 - Overall Change in Temperature (SSP370 ) (white 10pt)
At the bottom of each the maps:
- Map 3 - Climatic suitability for koalas (black 12pt)
- Map 4 - Projected suitability change (SSP370), current to 2090 (black 12pt)
- Map 5 - Priority areas for conservation (black 12pt)
To do this for each one:
- Click on the ‘Add Text’ button in the
Toolboxtoolbar- Draw a box either under or on the map as per the example
- Enter in the text
- Amend the font size and color as indicated
- Make the Horizontal Alignment ‘Center’
- Save your project
- Repeat for each element requiring a title
Use the enter in the text to add in multi-line text - just like in a word document.
Copy and paste the similar text elements to save time in styling
12 Print your map and review it
QGIS allows you to print out your map to a pdf, svg, image or hardcopy. Printing out the map allows you to review it to assess for quality.
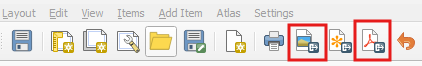
- Click on the image or pdf output buttons at the top
- Save as …v1
- Look through it and send it to someone to look through it
- Take on all recommendations and assess them
- Apply required the recommendations
- Print out to …v2 and then recheck with the same and different reviewers
Things we didn’t cover
Spacing When drawing a map from scratch, to get the spacing right, you can use the following tools:
- In the
Position and Size > Xfield, you can set a formula to set the placement:- length/fraction
- To place halfway on an A4: 297/2
- To place three quarters on an A4: 297*0.75
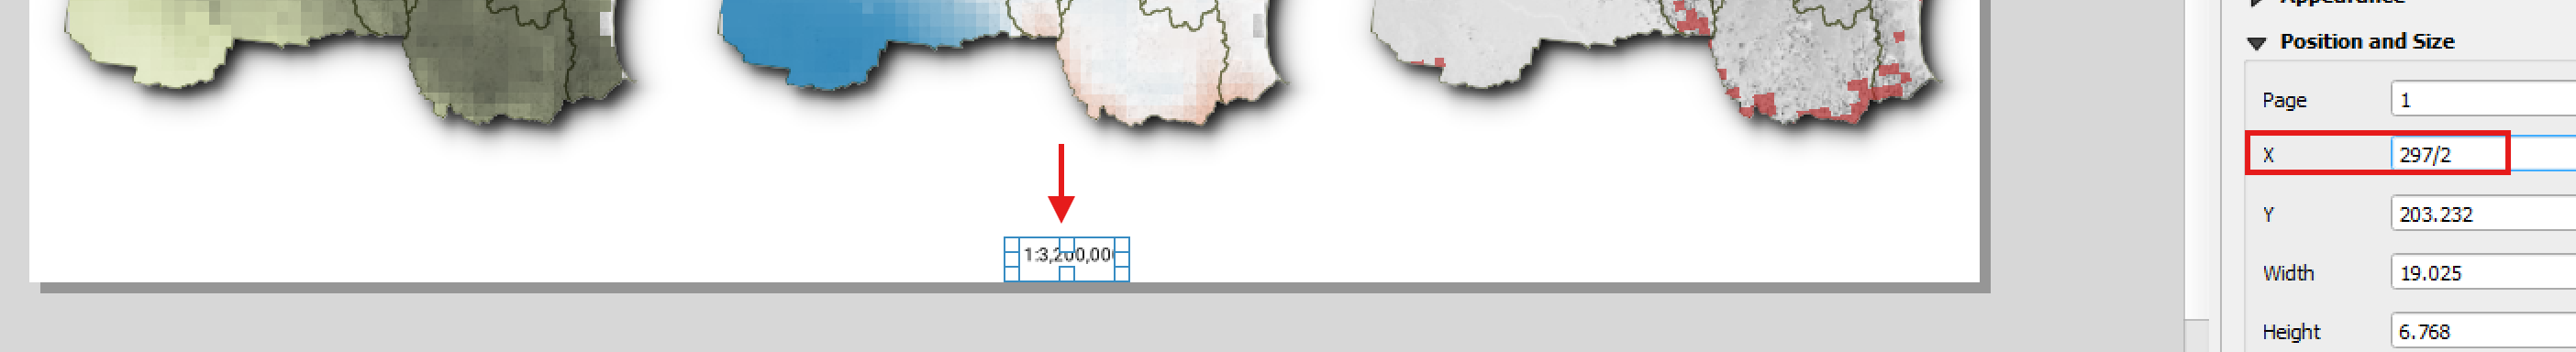
- length/fraction
- When trying to get the unfiform spacing between windows, much like the upper elements:
- Use the shape tool and set the required width e.g. 5mm and manually move it between the items and align the items to it
- Use the Distribution tool